Hispanic growth rate greater than mainstream
Posted by Elena del Valle on February 25, 2013
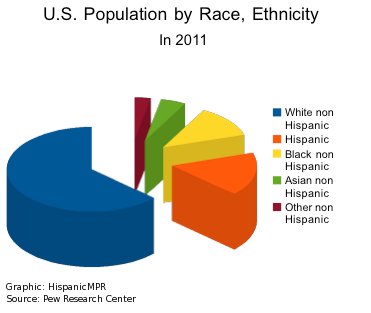
U.S. Population by Race, Ethnicity in 2011 – click to enlarge
In 2011, Hispanics represented 16.7 percent of the United States population and 23 percent of births. In other words, Latinos represented one sixth of the population and almost one quarter of all births. Those estimates, compiled by the Pew Research Center, include undocumented immigrants said to be as many as 12 million and 80 percent of which are thought to be Latinos. Two thirds of Hispanics can be found in just five states: California, Florida, Illinois, New York and Texas, according to analysis of U.S. Census and American Community Survey data by the Pew Research Center.
Overall, the Hispanic population grew 47 percent between 2000 and 2011 from 35.2 million, representing 12.5 percent of the country’s population, to 51.9 million. Growth in some states was higher. An example of such higher growth was Florida where the Hispanic population grew 62 percent in that time period.
Although high school drop out rates among Latinos 16 to 19 years of age are believed to have dropped significantly from 17.5 percent in 2000 to 6.8 percent in 2011 all is not rosy among the growing demographic group. The ethnic group had the next to lowest household income in 2011 when the median income of a Latino household was $39,000 compared to $67,000 for Asian households, $54,000 for whites and $32,600.
Also, 13 million Hispanics, 25.9 percent of the Latino population, are thought to live in poverty and 22 percent receive food stamps; placing second to last on those lists. African Americans at 27.9 percent in poverty and 28 percent on food stamps were the only ethnic group with more alarming conditions. At the same time, Latinos had the highest percent of people without health insurance, 30 percent, compared to 10.8 percent for non Hispanic whites, 15.4 percent for Asians and 18.6 percent for blacks.


(3) non-profit organization working to protect Florida’s springs through sound science and education")


 International")

